This help file will guide you through all the reporting data available in the Tickets section.
Before you start
- You’ll need to have access to Dashboards in your permissions. If you don’t have access, you can request it from an Admin user within your business.
Note: Certain sections of the Insights can be downloaded as a CSV. When this is possible you will see three dots showing on the top right-hand side.
01 Mailbox overview
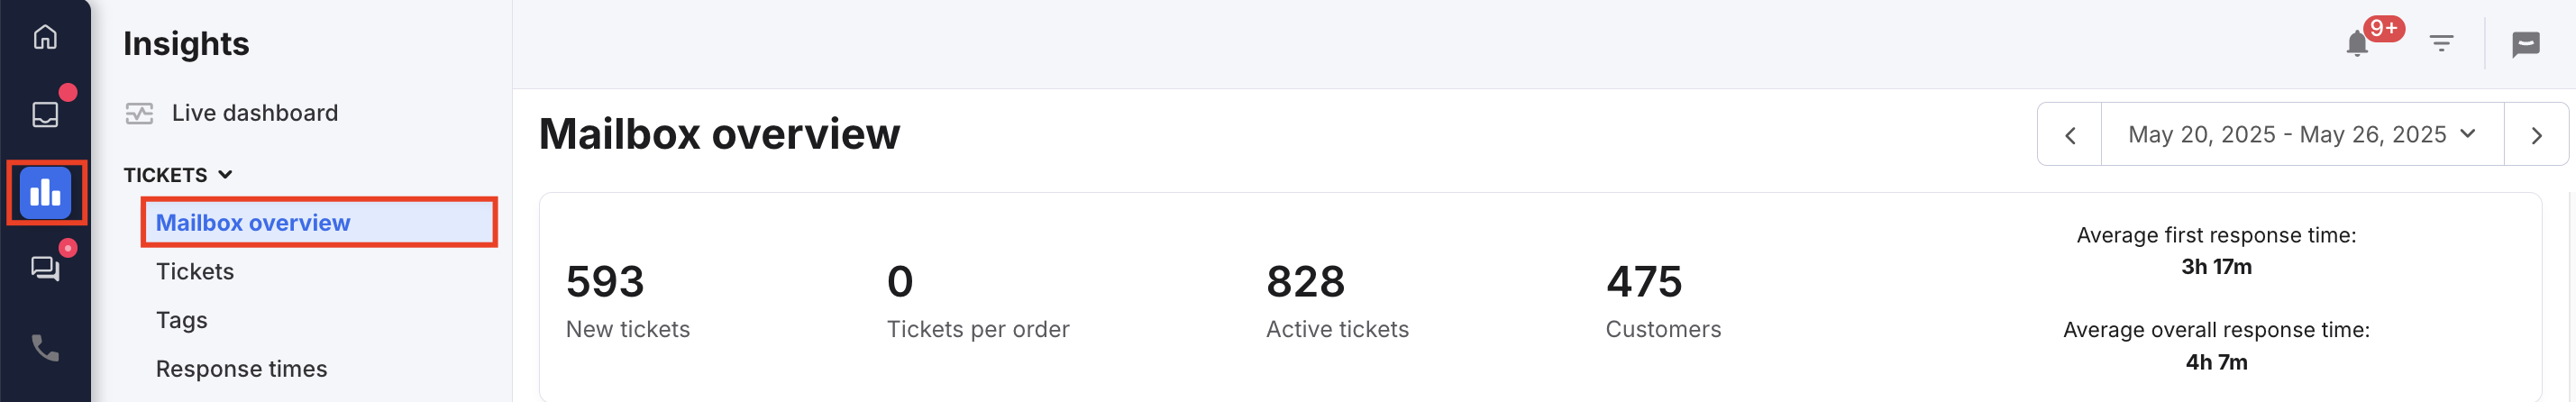
The first tab under the Tickets dropdown is the Mailbox overview, giving you insights on Messages, Active Tickets, Languages, and Tags.To access it, go to: Insights > Tickets dropdown > Mailbox overview
-
New Tickets
-
The total number of tickets created during the selected period.
-
-
Tickets per order
-
A calculation of the total number of tickets received per order.
-
-
Active Tickets
-
The total number of tickets that were active during the selected period.
-
-
Customers
-
The total number of customers who made contact/were contacted during the selected period.
-
-
Average first response time
-
The average time it takes you to send an initial response when a new ticket is created.
-
-
Average overall response time
-
The average time it takes you to respond to tickets in general.
-

-
Incoming messages
-
The total figure of all the incoming messages.
-
Multiple incoming messages inside one ticket are counted separately.
-
-
Outgoing messages
-
The total figure of all the outgoing messages.
-
Multiple outgoing messages inside one ticket are counted separately.
-
-
Active Tickets
-
The total number of tickets that were active during the selected period.
-
They could have been created at a different time, but active during the period.
-
This includes any status change or change made inside the ticket.
-
-
New Tickets
-
The total number of tickets created during the selected period.
-
These can be incoming or outgoing.
-
Further down, the Ticket breakdown, Feedback (if applicable), Languages, and Tags sections will allow you to quickly identify how many tickets you received for each channel, language, or tag.
02 Tickets
The second tab under the Tickets dropdown is the Tickets tab, giving you insights on the Heatmap, Channels, Tags, Query types and Languages.
To access it, go to: Insights > Tickets dropdown > Tickets

-
Download tickets
-
The option to download tickets is only available to Admin roles in eDesk. The Admin that requests the download will receive an email (to their eDesk log-in email) with a download link.
-
-
Tickets received
-
The total figure for all new tickets.
-
-
Resolved
-
The total number of tickets resolved.
-
-
One and done
-
The percentage of tickets resolved with one response and which did not reopen within the set period.
-
Note: The One and done parameter can be set in Account Settings (Account → Company Settings → Mailbox → One and done). To find out more about setting up your Company Settings, click here.
The Ticket heatmap shows events that have happened to your tickets. The darker the cell, the more events happened at the time. You can hover over a cell with your mouse to see more details about it.

You can also select what data you would like to see in the dropdown above the heatmap. The options in the dropdown are: Busiest time of the day, Tickets created, Tickets Resolved, Incoming messages, Sent messages, Sent Messages (not in xSellco), Auto replies, AI Auto replies, Internal Notes, External messages sent, External messages received.
Note: The Busiest Time of the day metric is calculated by combining the incoming and outgoing messages with the number of online agents.
Further down, the Channels and Tags sections will allow you to quickly identify how many tickets you received for each channel or tag so you know which ones need the most attention.
The Query types and Ticket languages show the different types of queries that came in on tickets and what languages they were in.
03 Tags
The third tab under the Tickets dropdown is the Tags section, giving you an overview of all the Tags and Tag Groups used in your eDesk account and whether you have tickets in the 'To Do', 'Waiting' or 'Snoozed' status.
To access it, go to: Insights > Tickets dropdown > Tags

To find out more about Tags, click here.
To find out more about Tag Groups, click here.
04 Response Times
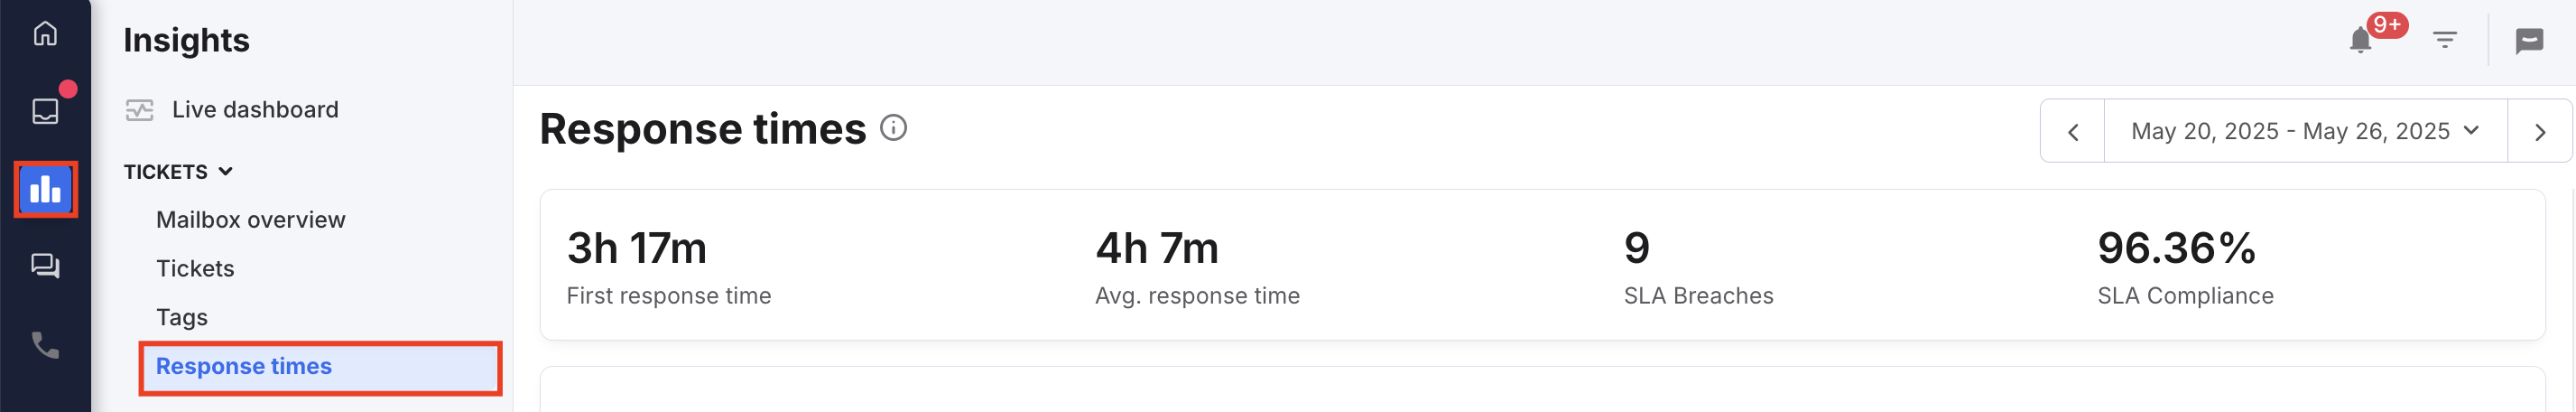
Finally, the fourth tab in the Tickets dropdown is the Response Times section, giving you an overview of your Response Times to customers within eDesk.To access it, go to: Insights > Tickets dropdown > Response Times
-
First response time
-
The average time it takes you to send an initial response when a new ticket is created.
-
-
Avg. response time
-
The average time it takes you to respond to tickets in general.
-
-
SLA Breaches
-
The number of tickets that went over the specified SLA.
-
-
SLA Compliance
-
The percentage of tickets that meet the specified SLA.
-

Pro Tip: You can click the different elements of the chart on or off for a cleaner view.
Further down, you can find more data on your response times, including:
-
Breakdown: this section displays the number of responses broken down by their response times. You can switch between the First tab which displays the response times of the very first reply on a ticket and the Avg tab which displays the average response of all other replies, excluding the initial reply.
-
Ticket Types: this section displays the response times broken down by ticket types. The number shown in each ticket type category represents the average response by ticket type and the progress bar on the right displays the time compared to the other ticket types in the table.
- SLA Compliance per channel: this section highlights your SLA Guideline performance. Analyze each of your channels to see if you are responding within the designated timescale. The closer to 100% the better. To find out more about SLAs in eDesk, click here.
Further Reading
To find out more about Chats Insights, click here.Interested in learning more about Agents Insights? Click here.